Propose new functionalities for Decidim software
#DecidimRoadmap Designing Decidim together
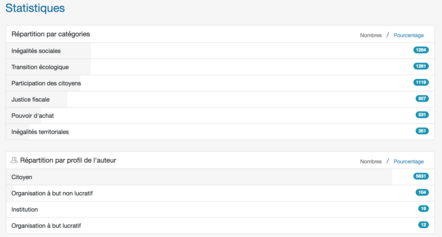
Add statistics block to show proposal repartition in categories and areas
We've seen this implemented by one of Decidim's competitor :
https://participez.lecese.fr/projects/avec-ou-sans-gilet-jaune-citoyennes-et-citoyens-exprimez-vous/stats
Check out the screen capture for an example.
Report inappropriate content
Is this content inappropriate?
6 comments
Conversation with Xabier
I think there was some of this planned, even a nicer visualization. Dataviz for the results of voting was a priority when I participated on the definition of the dataviz module, but there have been some complexities and delays. I am not sure about the status of this. Maybe @carol know more.
Another example of stats page @xabier @carol from another big french competitor https://about.make.org/about-aines
I cannot see the stats!
Click on the tab "consultation" at the top of the page
They seem to be handmade and then uploaded as an image. In any case, I believe it to be critical that we display visualizations over support/voting results! and we had very nice mockups from PX on githbu, not sure what happened. @oliver_valls do you know anything?
Hi @virgile_deville and @xabier, we narrowed down the first version of the dataviz module for visualizations in the general homepage and in a process homepage. In fact it is a module that needs to be reviewed well because it presents some problems.
We need more iterations for other types of visualizations.
I must say, however, that pie chart visualizations are usually discouraged by data visualization experts. Am I right @elaragon? 😜
Add your comment
Sign in with your account or sign up to add your comment.
Loading comments ...